17.1 Truncation
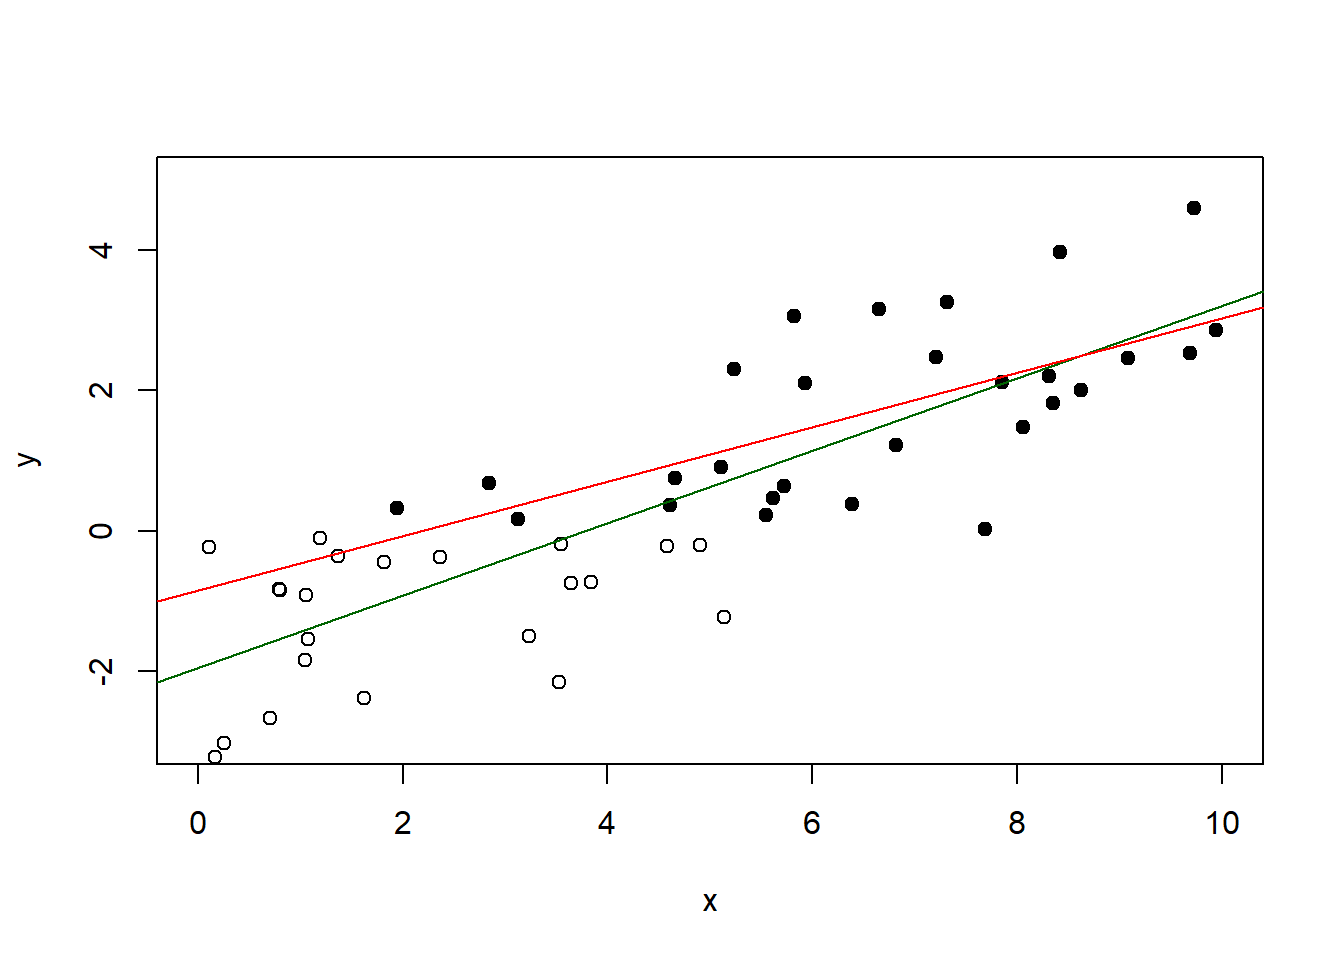
In the case of truncation, a certain part of the data is not observed. In the graph below, the true parameters are \(\beta_0=-2\) and \(\beta_1=0.5\). Values \(y<0\) are not reported in the data. The green regression line is “correct” whereas the “red” is the line obtained from a regression model which ignores the truncation.
 If all the data was observed, the correct regression model would give the following results:
##
## Call:
## lm(formula = yreal ~ x, data = truncation)
##
## Residuals:
##      Min       1Q   Median       3Q      Max
## -2.45723 -0.63666 -0.03296  0.38819  2.99058
##
## Coefficients:
##             Estimate Std. Error t value Pr(>|t|)
## (Intercept) -1.68485    0.28475  -5.917 3.36e-07 ***
## x            0.46946    0.04912   9.558 1.09e-12 ***
## ---
## Signif. codes:  0 '***' 0.001 '**' 0.01 '*' 0.05 '.' 0.1 ' ' 1
##
## Residual standard error: 1.065 on 48 degrees of freedom
## Multiple R-squared:  0.6556, Adjusted R-squared:  0.6484
## F-statistic: 91.36 on 1 and 48 DF,  p-value: 1.088e-12
The estimates are biased if truncation is ignored:
##
## Call:
## lm(formula = yobs ~ x, data = truncation)
##
## Residuals:
##     Min      1Q  Median      3Q     Max
## -2.2554 -0.7112 -0.1435  0.4393  3.2184
##
## Coefficients:
##             Estimate Std. Error t value Pr(>|t|)
## (Intercept) -0.43921    0.53877  -0.815  0.42138
## x            0.32155    0.07741   4.154  0.00025 ***
## ---
## Signif. codes:  0 '***' 0.001 '**' 0.01 '*' 0.05 '.' 0.1 ' ' 1
##
## Residual standard error: 1.102 on 30 degrees of freedom
##   (18 observations deleted due to missingness)
## Multiple R-squared:  0.3651, Adjusted R-squared:  0.3439
## F-statistic: 17.25 on 1 and 30 DF,  p-value: 0.0002499
To correct for the truncation, use the functions from the package truncreg which allows to reduce the bias of the coefficients:
##
## Call:
## truncreg(formula = yobs ~ x, data = truncation)
##
## BFGS maximization method
## 39 iterations, 0h:0m:0s
## g'(-H)^-1g = 2.1E-10
##
##
##
## Coefficients :
##             Estimate Std. Error t-value  Pr(>|t|)
## (Intercept) -4.69799    2.54350 -1.8471  0.064739 .
## x            0.79754    0.28429  2.8054  0.005026 **
## sigma        1.44816    0.33121  4.3724 1.229e-05 ***
## ---
## Signif. codes:  0 '***' 0.001 '**' 0.01 '*' 0.05 '.' 0.1 ' ' 1
##
## Log-Likelihood: -38.271 on 3 Df