7.1 Law of Large Numbers
The unemployment rate in the United States is measured via the Current Population Survey (CPS) which samples 60,000 households on a monthly basis. People are classified into employed, unemployed, not in the labor force. The reason for this large sample is that the larger the sample, the smaller the margin of error (more on that concept below). This is a result of the law of large numbers. Any feature of a distribution can be recovered from repeated sampling. In particular, the law of large number can be spelled out as \[\lim_{n \rightarrow \infty} P(|\bar{X}_n - \mu | > \epsilon) = 0\] For example, if you flip a coin, there are two possible outcomes: heads or tails. The expected value of heads (or tails) is \(E(H)=E(T)=0.5\). The variance of \(n\) coin tosses is \[Var(n) = \frac{p \cdot (1-p)}{n}\]
Note that \(p \cdot (1-p)\) is the variance associated with a Bernoulli. So the variance of \(n\) coin tosses is \(Var(1) = 0.5\), \(Var(10) = 0.025\), \(Var(1000) = 0.00025\), etc. It is difficult to predict the share of heads from a single coin toss but high prediction precision from several thousand tosses.
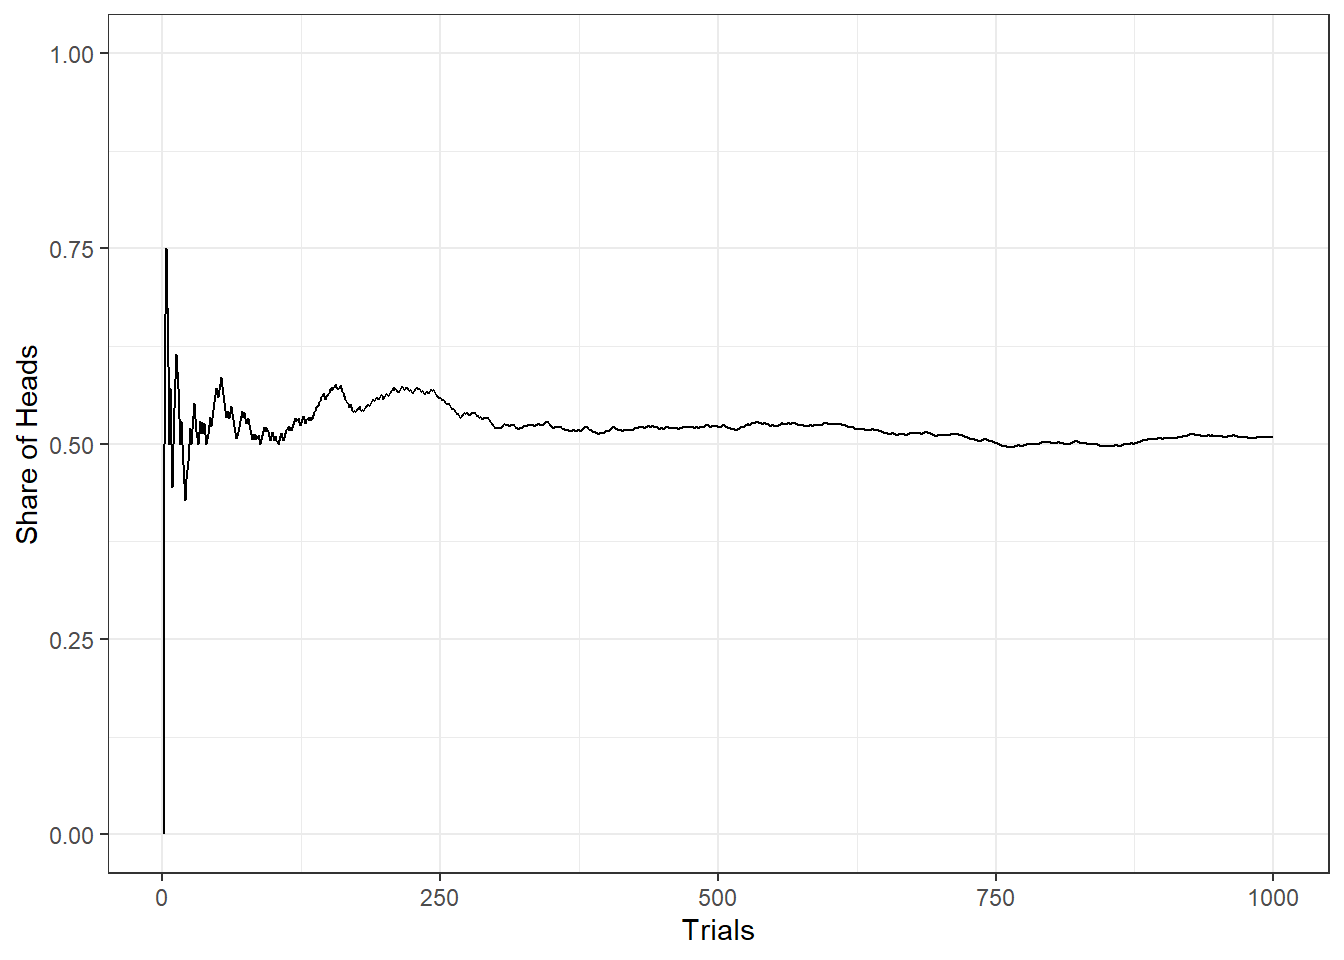
Figure 7.1: Law of Large Numbers illustrated by flipping a coin up to 50,000 times.
There are very important implications, e.g., insurance business. If there is risk aversion for individuals as well as for firms, why do insurance companies exist? Let us illustrate how the law of large numbers can help us answer this question. Assume an insurance company that sells home insurance policies. The probability of a fire is \(P(fire)=1/250=0.004\). Each home is valued at $250,000 and the value of the home after a fire is $0. The insurance premium is equal to the expected loss, i.e., $1000. In a simulation exercise, the damage to \(n\) homeowners (where \(n\) is the number of homes insured) and the share of homes burned down is calculated. The exercise is repeated a 1000 times and then a histogram is generated.
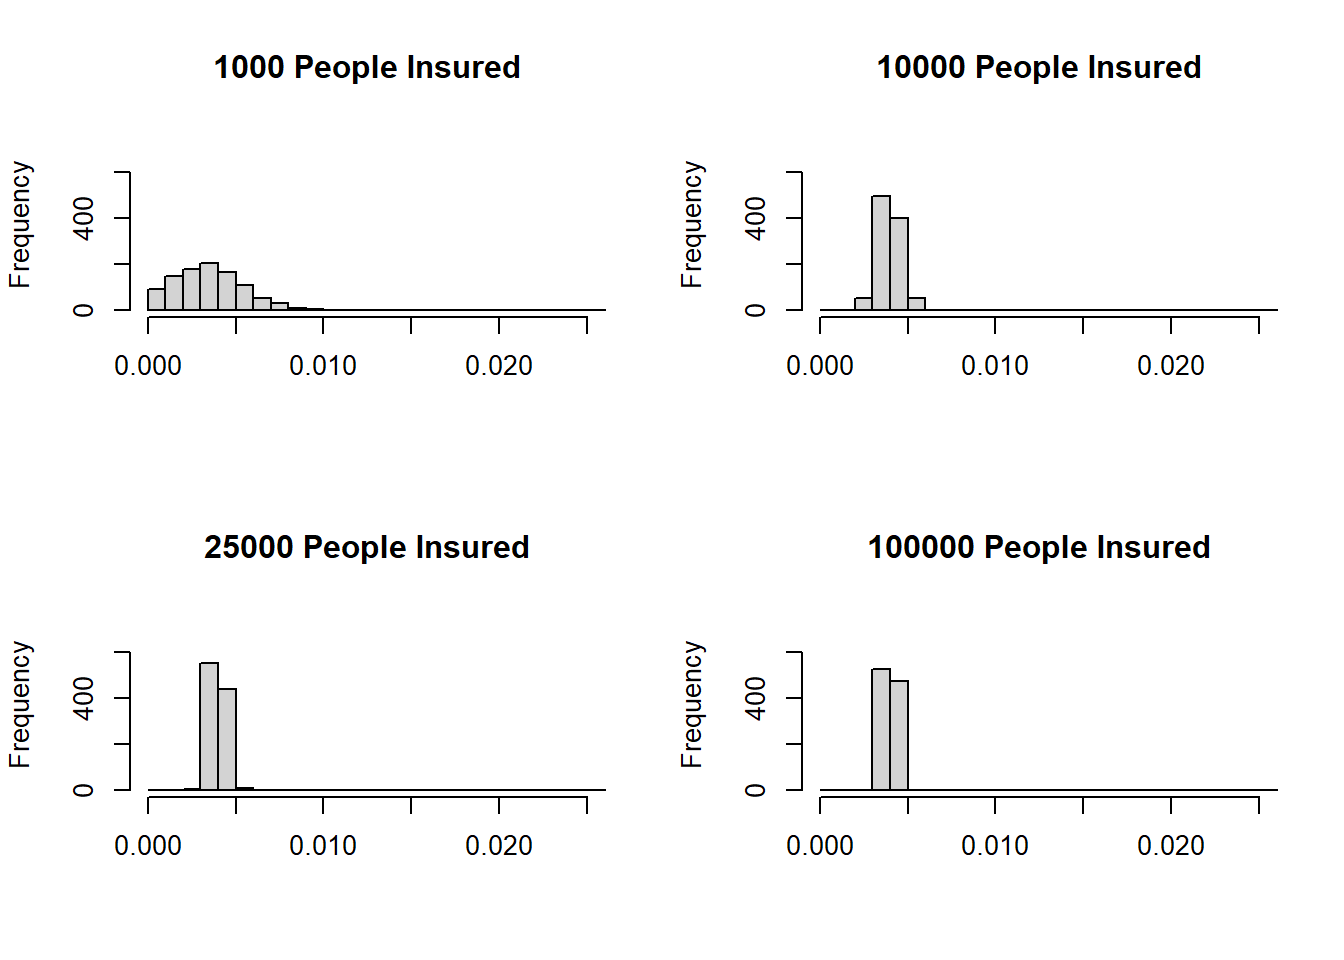
Figure 7.2: Risk pooling by an insurance company.