2.1 Overview
We are surrounded by probability and statistics on a daily basis because the world around us is uncertain. The purpose of probability theory and statistics is to explain and model stochastic processes such that predictions can be made. Probability and the application of statistics occur basically everywhere. For example, if you order something online, other products are suggested to you. Those suggestions are not random but are based on how you compare to other shoppers interested in similar items. Consider the following examples:
- Grades: If you take a university class then the grade you receive in the class is uncertain at the beginning of the semester. You may attach different probabilities associated with the various grades based on your knowledge about the material.
- 911 calls: While getting my graduate degree at Iowa State University, I was standing at a red light one morning which had a fire station down the road. Two fire trucks with their sirens on arrived at the red light and departed in opposite directions. Thus, two 911 calls must have come in at the same time requiring two trucks from the same station. The fire station has three trucks and as a public safety manager, you may be interested in the probability of more than three trucks being requested.
- Basketball free throws: Just because there are two outcomes does not mean that the probability is 50%/50%. Stephen Curry is the career leader in terms of free throw percentage (90.56%). Either he scores or misses, and his success rate is far from 50%.
- Polls: Especially before elections, polls are very popular to determine which candidate is favored. The polling results usually include a so-called margin of error which is an indicator of confidence in the results. The chapter on confidence intervals explains how the margin of error is calculated.
- Hurricanes: Projected pathways of Hurricanes, e.g., Sandy in 2012, produced by the National Hurricane Center (NHC) include so-called cones of uncertainty. The NHC defines the cone of uncertainty as follows: The cone represents the probable track of the center of a tropical cyclone, and is formed by enclosing the area swept out by a set of circles along the forecast track (at 12, 24, 36 hours, etc.). The size of each circle is set so that two-thirds of historical official forecast errors over a 5-year sample fall within the circle. Based on forecasts over the previous 5 years, the entire track of a tropical cyclone can be expected to remain within the cone roughly 60-70% of the time. It is important to note that the area affected by a tropical cyclone can extend well beyond the confines of the cone enclosing the most likely track area of the center.
- COVID-19: A recent example is the COVID-19 risk assessment chart developed by the Texas Medical Association. The risk categories can be thought of as probabilities of contracting COVID-19 for the activities listed. They also updated their chart to account for COVID Risks of Various Holiday Activities.
If you are working and receiving retirement benefits, you are likely investing those in mutual fund. The saying “do not put all your eggs in one basket” applies in this context. The figure below shows the evolution of Vanguard 500 Index Fund Investor Shares (VFINX) and the Fidelity Select Retailing Portfolio (FSRPX). Although not perfectly, the funds generally move in the same direction.
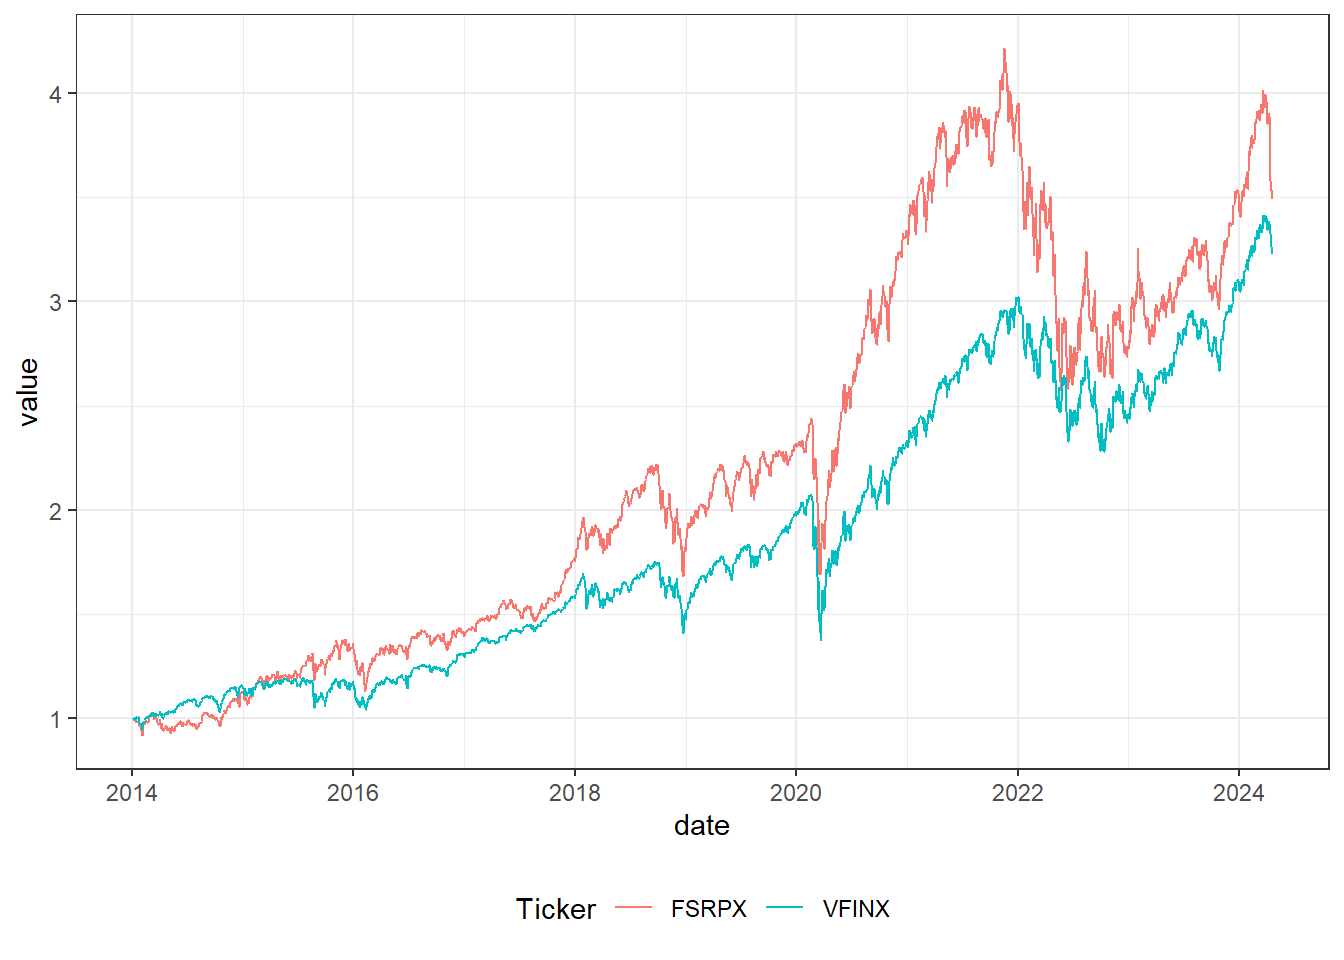
Figure 2.1: Evolution of the Vanguard 500 Index Fund Investor Shares (VFINX) and Fidelity Select Retailing Portfolio (FSRPX)
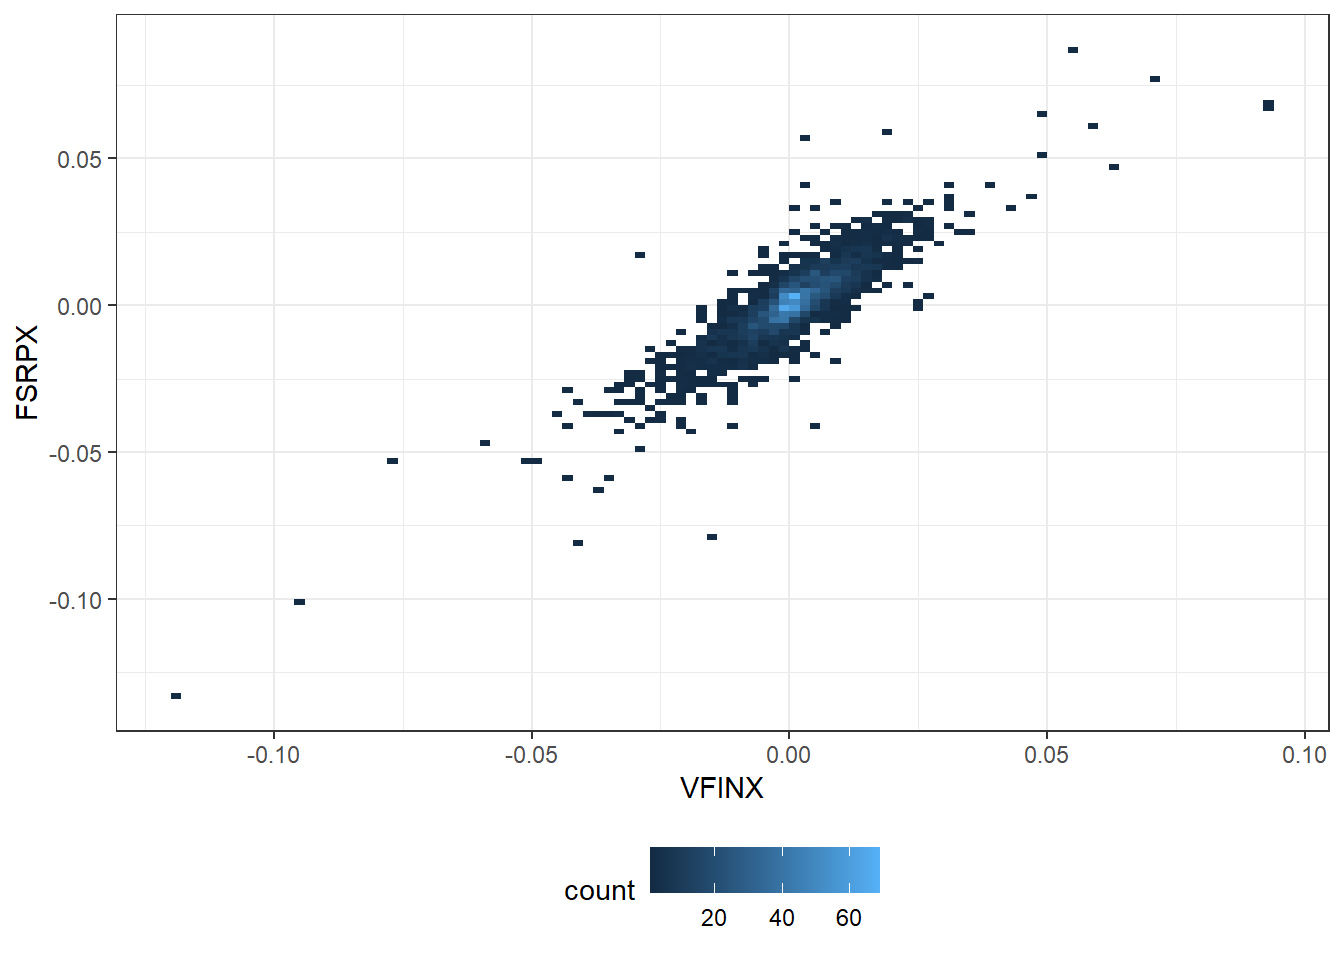
Figure 2.2: Scatter plot and indication of frequency of the daily returns of VFINX and FSRPX
Both graphs indicate a certain degree of positive association between the returns, i.e., if one of the mutual funds increases, the other tends to increase as well (and vice versa).
This course can be subdivided into three large topics: probability, statistics, and regression. The basics of probability provide means for modeling populations, experiments, and any other random phenomena. You will be introduced to probability distributions that allow you to model random outcomes. Probability theory is also the foundation for statistics. Statistics allows us to learn something about the population based on a sample. Sampling distributions, confidence intervals, and hypothesis testing will be important concepts. The last part will cover regression analysis which states mathematical relationships among variables. For example, the price of a used car can be expressed as a function of model, year, mileage, and cylinders.
To illustrate the difference between probability and statistics let us consider two buckets. The first bucket illustrates the concept of probability and the second bucket illustrates the concept of statistics. Suppose that in the first bucket, you have a bunch of balls of different colors: Green, black, and red. And you also know how many of each color are in the bucket. Probability theory tells you the expected number of green, red, and black balls in your hand after pulling out a bunch of balls from the bucket. It will tell you the likely distribution of colors in your hand.
Statistics is different. Again, you have a bucket but you do not know what is in the bucket. Think about the content of the bucket as your population with unknown characteristics. To learn about the characteristics of the population, you pull out a sample from the bucket. Based on the distribution of colored balls in your hand, you can use statistics to say something of the characteristics of your population, that is, the content of the bucket in this case.