11.4 Public Services and Rate Setting
We mentioned before that property taxes are an important source for local government funding. In this section, we determine how property tax rates are set by linking them to expenditures. In this example, we have six parcels (labeled A through F) and four public services: (1) Two school districts, (2) three Waste water treatment districts, (3) two fire districts, and (4) three library districts. The graph below illustrate the distribution of school district across the parcels. The number in parenthesis is the assessed value.
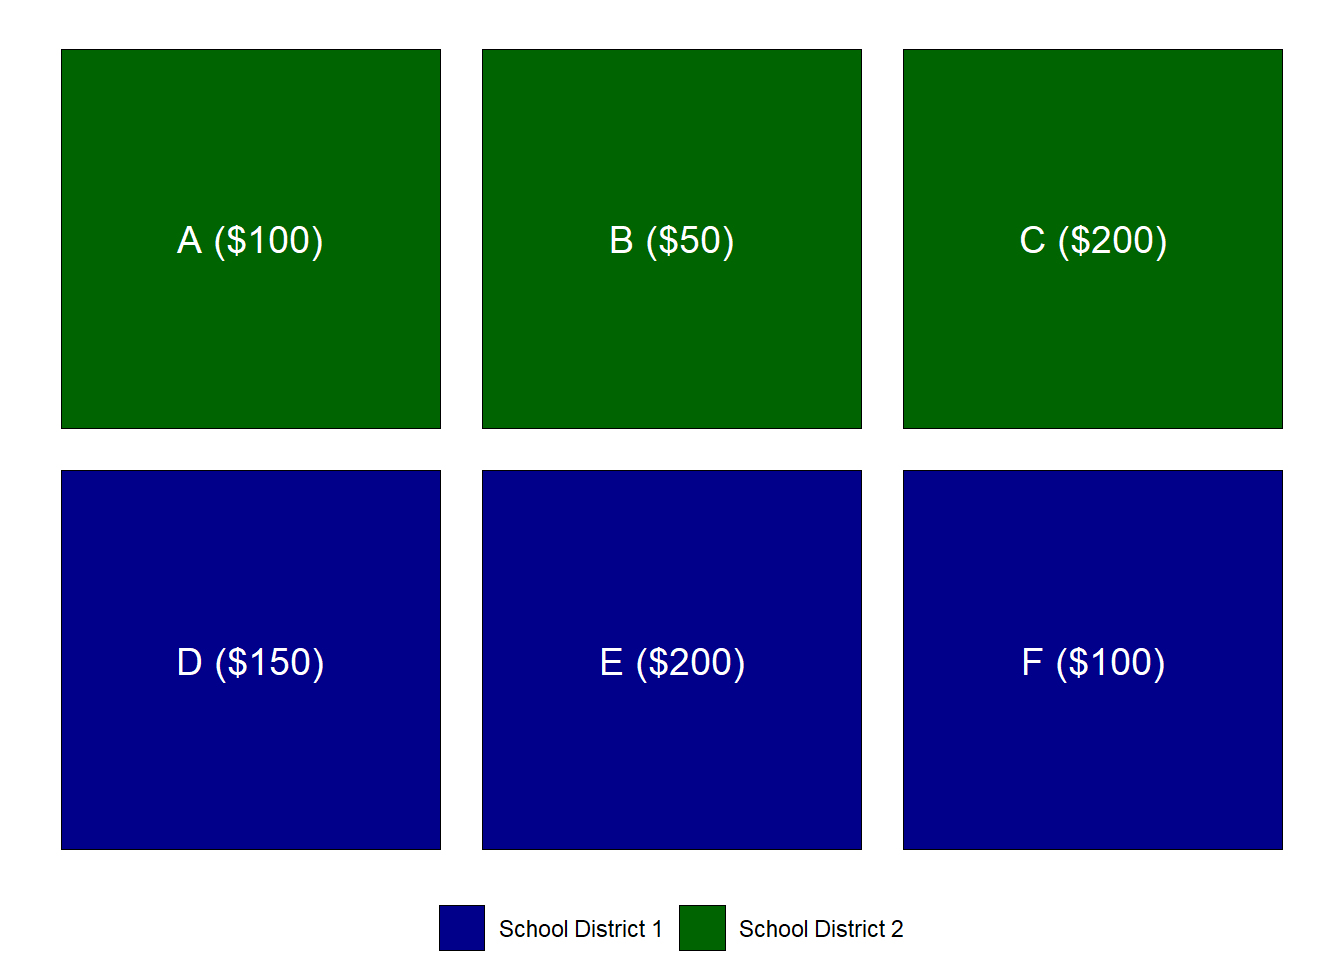
Figure 11.1: Example Distribution of Assessed Values and School District
The parcel allocation and expenditures can be summarized as follows in a table:
| ID | Public Service | Parcels | Expenditure | Tax Base | Millage |
|---|---|---|---|---|---|
| 1 | School District 1 | A+B+C | 20 | 350 | 0.0571 |
| 2 | School District 2 | D+E+F | 10 | 450 | 0.0222 |
| 3 | Waste Water District 1 | A+D | 5 | 250 | 0.0200 |
| 4 | Waste Water District 2 | B+E | 5 | 250 | 0.0200 |
| 5 | Waste Water District 3 | C+F | 5 | 300 | 0.0167 |
| 6 | Fire District 1 | A+B+D+E | 40 | 500 | 0.0800 |
| 7 | Fire District 2 | C+F | 20 | 300 | 0.0667 |
| 8 | Library 1 | B+D+E+F | 60 | 500 | 0.1200 |
| 9 | Library 2 | A | 10 | 100 | 0.1000 |
| 10 | Library 3 | C | 10 | 200 | 0.0500 |
And thus, the rate by parcel is as follows:
| Parcel | Value | School | Waste | Fire | Library | Millage | Tax Bill |
|---|---|---|---|---|---|---|---|
| A | 100 | 1 | 1 | 1 | 2 | 0.2571 | 25.71 |
| B | 50 | 1 | 2 | 1 | 1 | 0.2771 | 13.86 |
| C | 200 | 1 | 3 | 2 | 3 | 0.1905 | 38.10 |
| D | 150 | 2 | 1 | 1 | 1 | 0.2422 | 36.33 |
| E | 200 | 2 | 2 | 1 | 1 | 0.2422 | 48.44 |
| F | 100 | 2 | 3 | 2 | 1 | 0.2256 | 22.56 |