2.1 Federal Government
A term that is used often throughout the book is Gross Domestic Product (GDP). The Bureau of Economic Analysis (BEA) defines GDP as follows:
The value of the goods and services produced in the United States is the gross domestic product.
Economic growth is measured by changes in the GDP and is an important macroeconomic indicator. GDP growth (or lack thereof) serves as an important indicator for recession dating besides employment levels. The National Bureau of Economic Research (NBER) announced the following by its Business Cycle Dating Committee on January 7, 2008:
We view real GDP as the single best measure of aggregate economic activity. In determining whether a recession has occurred and in identifying the approximate dates of the peak and the trough, we therefore place considerable weight on the estimates of real GDP issued by the Bureau of Economic Analysis (BEA) of the U.S. Department of Commerce.
Let us next present some broad numbers illustrating the size of the U.S. government in terms of expenditures (also called outlays) and revenue. Those numbers are taken from the CBO’s Federal Budget 2022. There are two broad categories of outlays. Discretionary outlays (e.g., defense) go through the annual appropriation process. As opposed to the discretionary outlays, mandatory outlays (e.g., Social Security, Medicare, Medicaid) do not go through the appropriation process. The total government revenue in 2022 was $4.9 trillion from the following, broad sources:
- Individual income taxes ($2.6 trillion)
- Payroll taxes such as Social Security ($1.5 trillion)
- Corporate income taxes ($425 billion)
- Other revenues such as excise taxes, estate and gift taxes, customs duties
Government expenditures (outlays) amounted to $6.3 trillion in the following categories:
- Mandatory spending ($4.1 trillion)
- Discretionary spending ($1.7 trillion)
- Net interest ($475 billion)
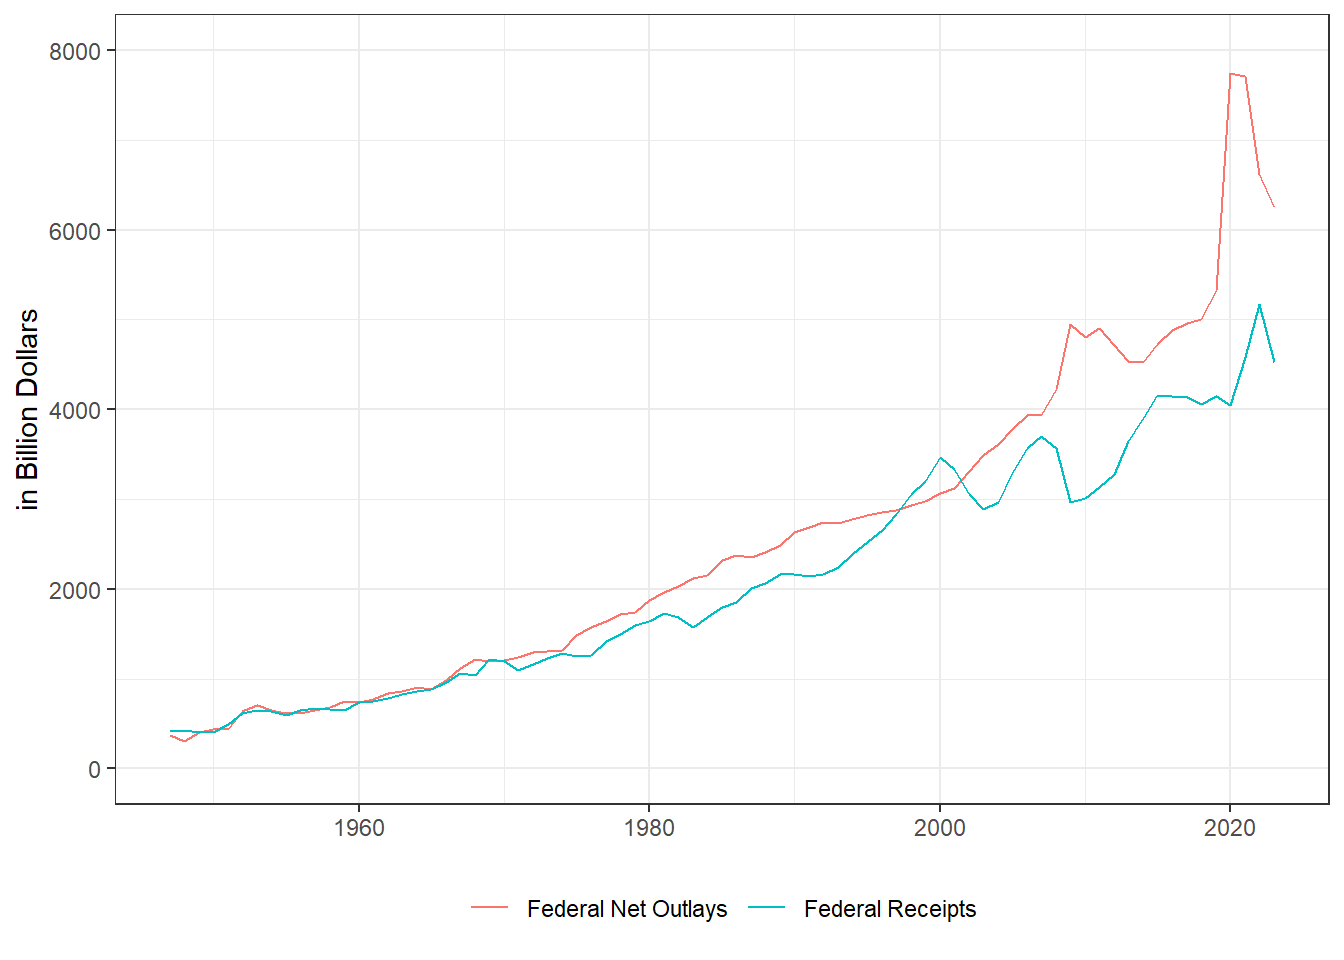
Note the difference (deficit) between the expenditures and revenue of about $1.4 trillion. Below are the federal net outlays and receipts in real terms, that is, adjusted for inflation.
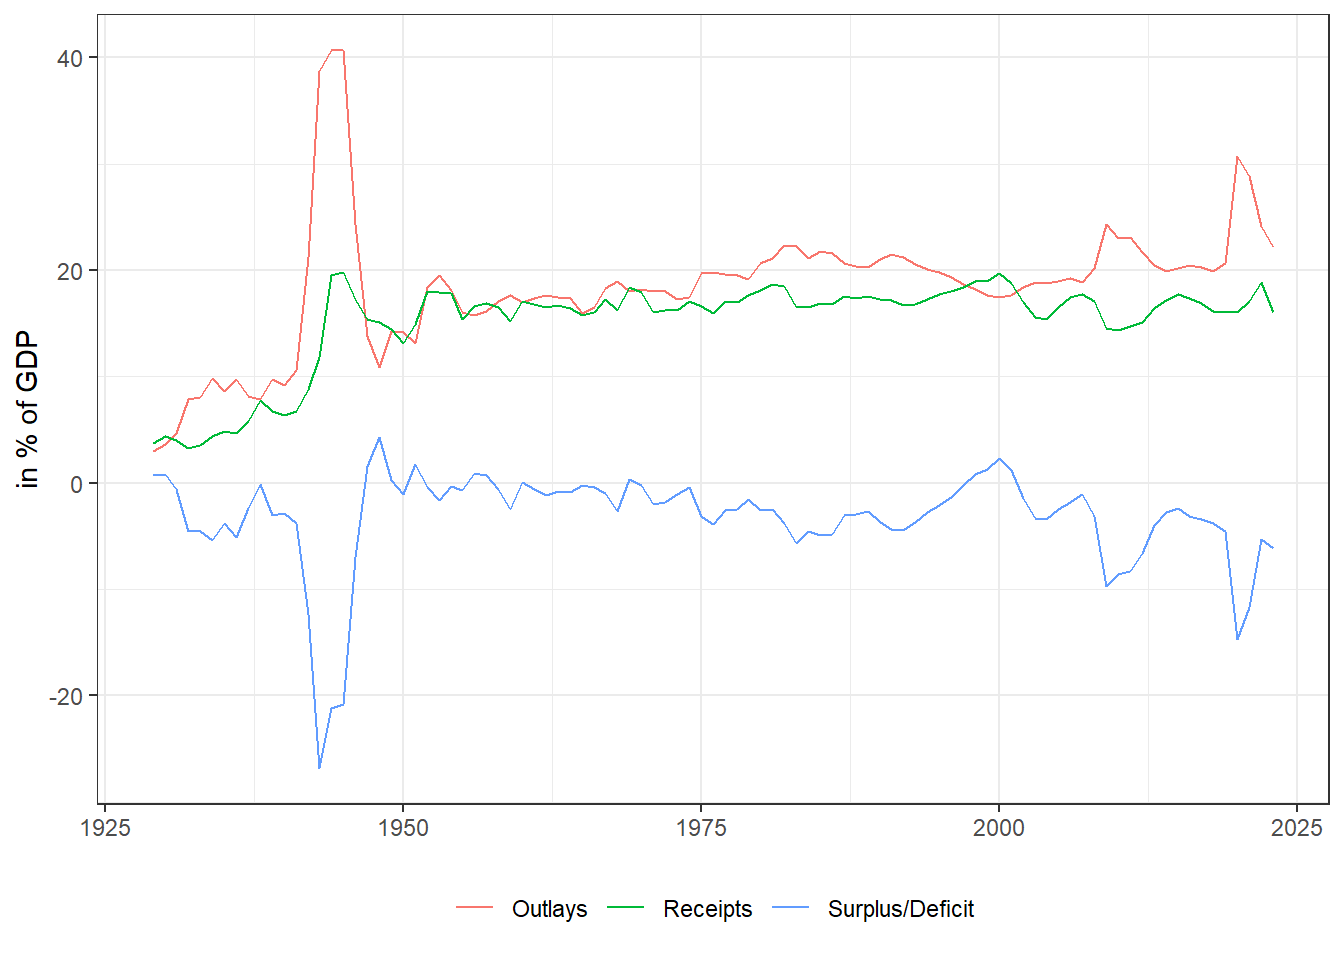
Although the previous graph suggested a significant increase in outlays and revenue, the size of the U.S. government as a percentage of GDP has been relatively stable over time given the Federal Receipts as Percent of Gross Domestic Product, Federal Net Outlays as Percent of Gross Domestic Product, and Federal Surplus or Deficit as Percent of Gross Domestic Product.
Given the deficit and associated debt, which needs to be financed, there is often a discussion regarding which countries hold how much U.S. debt. For January 2023, the Major Foreign Holders of Treasury Securities (in billion USD) were the following countries:
| Top 10 Countries | Jan-23 | GDP | Ratio |
|---|---|---|---|
| Japan | $1,104 | $4,231 | 26.1% |
| China | $859 | $17,963 | 4.8% |
| UK | $668 | $3,071 | 21.8% |
| Belgium | $331 | $579 | 57.2% |
| Luxembourg | $318 | $82 | 387.8% |
| Switzerland | $291 | $ 808 | 36.0% |
| Cayman Islands | $285 | ||
| Canada | $254 | $2,140 | 11.9% |
| Ireland | $253 | $529 | 47.8% |
| Taiwan | $235 |